
Effects of exhaust gas emissions
Screening of biological activity of exhaust gases can be conducted by using different tests, for example Ames test for mutagenicity, which is a term related to genotoxicity and carcinogenesis. However, the bacterial test does not reflect in vivo mutagenic activity, nor it is capable to accurately predict the risk of carcinogenicity in mammals. Reactive oxygen and nitrogen species are thought to be related to oxidative stress associated with inflammation and tissue damage in the cells and lungs. Many test methods are available for monitoring biological activity of the exhaust gases.
Biological tests are often carried out on the PM of the exhaust gases. However, a comprehensive view on the toxical effects of the exhaust gases would require exposure of the living cells or cell cultures to the exhaust aerosol as a whole (i.e. gaseous components and particles). IEA-AMF Annex 42 gathered information on the studies on toxicity of exhaust gases. Research activities on toxicology have been conducted in several countries with focus on different emission sources using epidemiological or cohort studies, exposures in vivo (humans or animals) and exposures in vitro. Harmonized international biological test method with a holistic approach of the exposure of human lung cells to the exhaust aerosol as emitted is not established. Further efforts are needed to develop reliable methodology (IEA-AMF Task 42: Czerwinski, J. 2014).
Ozone occurs naturally in the stratosphere approximately 10 to 30 miles above the earth’s surface and forms a layer that protects life on earth from the sun’s harmful rays. The major ozone losses have been due to the halocarbons gases. The N2O probably plays the dominant role in the depletion of stratospheric ozone layer when concentrations of halocarbons reach the pre-industrial concentrations. (Portmann 2012).
Ground-level tropospheric ozone
Ground-level ozone (O3) causes adverse health effects, for example irritation of the respiratory system, coughing and reduction of lung function. Ozone may aggravate asthma. There is also evidence of the effect of ozone on, for example, cardiovascular-related morbidity. Potential interactions between ozone and PM have been suggested. Ozone contributes to damage to plants and ecosystems. The adverse effects of ozone on forest and other natural vegetation may lead to species shifts and loss from the affected ecosystems, resulting in the loss or reduction of related goods and services (US EPA 2007). The tropospheric ozone (lifetime ~12 years) increases global warming. Ozone is not an emitted as such, while it is formed by the precursor emissions of CO, VOCs and NOx (Akimoto et al. 2011).
Ground-level tropospheric ozone is created in the presence of NO2, VOCs, heat and sunlight (i.e. photochemical reactions). Ozone precursors arise from both natural and anthropogenic sources. Urban areas may have high ozone levels on warm, sunny days, but even rural areas may experience elevated ozone levels due to transported emissions with the movement of an air mass from one region to another (Vallero 2014).
The simplified summary of complex formation of ozone in the troposphere is presented here based on Drechsler (2004). Ozone is formed in the troposphere by addition of atomic oxygen to molecular oxygen (1).
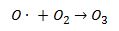 (1)
(1)
The atomic oxygen needed for this reaction is produced from photolysis of NO2 (2).
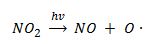 (2)
(2)
The reaction ends by reaction of ozone and NO back to NO2 and O2, forming a nitrogen cycle. When these reactions are in balance, the net ozone concentration does not increase or decrease.
When ratio of the NO2 to NO is low, ozone is not accumulated by the nitrogen cycle. Ozone accumulates only when excessive NO2 is formed and ozone is not destroyed. The photochemical oxidation of VOCs, such as hydrocarbons and aldehydes, provides the pathway to formation of excessive NO2.
VOCs are oxidized in the atmosphere typically driven by hydroxyl radical (OH.) attack (3) to form peroxy radical. R can be hydrogen or any organic fragment. Hundreds of VOC species participate in thousands of similar reactions.
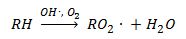 (3)
(3)
The key reaction in the VOC oxidation cycle is the conversion of NO to NO2 by the radical transfer reaction (4). This production of NO2 is necessary to generate atomic oxygen (2) and further ozone (1).
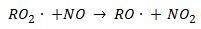 (4)
(4)
Ozone is consumed in the presence of for example water vapor, nitrous acid (HONO) and hydrogen peroxide (formed by hydroxyl radical). Reaction of NO2 with OH produces nitric acid, HNO3, which is a sink of NO2 and radical thus inhibiting the net ozone formation. However, in some conditions HNO3 may regenerate to NO2. (Drechsler 2004).
In the early morning, the urban NOx is mainly in a form of NO, because free radicals are not sufficiently present to convert of NO to NO2. When photolysis of VOCs starts, NO2 becomes dominant and ozone builds up. VOC reactions are relatively slow and thus the highest ozone concentrations may be observed many kilometres from the emission sources. During the night, NO and ozone combine to form NO2 and oxygen until either of the reactants is consumed. HONO may assists ozone formation when sunlight breaks it down to NO and OH, which further reacts with VOCs (3, 4). (Drechsler 2004).
VOCs are necessary to generate high concentrations of ozone, but NOx emissions can be the limiting factor for the high ozone concentrations. When the NOx concentration is high and the VOC concentration low (VOC/ NOx ratio low, "VOC-limited", NOx tends to inhibit ozone formation. When the VOC concentration is high relative to NOx (VOC/ NOx ratio high, " NOx -limited"), NOx tends to generate ozone (Drechsler 2004).
Photochemical reactivity of VOCs
Photochemical reactivity describes a VOC's ability to participate in photochemical reactions to form ozone in the atmosphere. Examples of the reactive VOCs in California include propene, m-xylene, ethene, and formaldehyde. (Drechsler et al. 2004).
Individual VOC species contribute very differently to formation of oxidants and ozone. Carter and Atkinson (1987) developed a maximum incremental reactivity (MIR) scale to assess the ozone-forming potential (OFP) of any emitted molecule (Equation 5).
OFP = S (MIR x mass emissions) (5)
The MIR values for selected individual hydrocarbons and oxygen-containing compounds are shown in Table 1 (Carter 2010).
Table 1. Maximum incremental reactivity (MIR) values of selected compounds (Carter 2010).
|
|
MIR |
|
|
MIR |
|
carbon monoxide |
0.056 |
ethanol |
1.53 |
|
|
methane |
0.0144 |
isobutanol |
2.51 |
|
|
ethane |
0.28 |
n-butanol |
2.88 |
|
|
ethene |
9.00 |
ETBE |
2.01 |
|
|
propane |
0.49 |
formaldehyde |
9.46 |
|
|
propene |
11.66 |
acetaldehyde |
6.54 |
|
|
acetylene |
0.95 |
acrolein |
7.45 |
|
|
isobutene |
6.29 |
propionaldehyde |
7.08 |
|
|
1,3‑butadiene |
12.61 |
crotonaldehyde |
9.39 |
|
|
benzene |
0.72 |
methacrolein |
6.01 |
|
|
toluene |
4.00 |
butyraldehyde |
5.97 |
|
|
ethyl benzene |
3.04 |
benzaldehyde |
-0.67 |
|
|
m-xylene |
9.75 |
valeraldehyde |
5.08 |
|
|
p-xylene |
5.84 |
m-tolualdehyde |
-0.59 |
|
|
o-xylene |
7.64 |
hexanal |
4.35 |
Risk factors and external costs for emissions
Emissions impose indirect, external costs on society related to impacts in health and environment and climate change. The monetary values of these impacts have been evaluated to determine the lifetime costs of, for example, exhaust emissions from transport vehicles. Directive 2009/33/EC defines the following external costs for CO2, NMHC, NOx and PM:
o CO2 €30–40/tonne
o NMHC (without methane) €1000/tonne
o NOx €4400/tonne
o PM €87 000/tonne.
There are also published external costs for CO and HC emissions in addition to those for NOx, PM2.5 and CO2 emissions, for example defined by Tiehallinto (2001) in Finland:
o CO €29/tonne
o HC (with methane) €62/tonne.
Risk factors for calculating the cancer potency of exhaust gas, as defined by OEHHA (2009), US EPA IRIS (2010) and The Nordic Ecolablelling (2008), are shown in Table 2. OEHHA (2009) defines cancer unit risks and potency factors for 107 carcinogenic substances or groups of substances. The US EPA IRIS, Integrated Risk Information System, is a human health-assessment program that evaluates quantitative and qualitative risk information for effects that may result from exposure to environmental contaminants. The Nordic Swan labelling criteria for biofuels define substances, which are measured in accordance with a particular protocol, and calculate the cancer potency of exhaust gas using risk factors (Nordic Ecolabelling 2008).
The most significant differences in the risk factors defined by different organizations concern ethene and propene emissions, which are included in Nordic Ecolabelling but not in the other definitions. Törnqvist et al. (1994) reported that ethene is metabolized in animals and in humans to a probable human carcinogen, ethylene oxide. Similarly, propene is metabolized to propylene oxide.
Table 2. Substances and risk factors for calculating the cancer potency of exhaust gas according to OEHHA (2009), US EPA IRIS (2010) and Nordic Ecolabelling (2008).
|
Substance |
Unit Risk Factor (µg/m3)-1 |
Normalized a |
||
|
Nordic Ecolabelling |
OEHHA 2009 |
US EPA IRIS 2010 |
||
|
Particulate matter |
7 x 10⁻⁵ |
30 x 10-5 |
insuff. Data |
177 |
|
Benzene |
0.8 x 10⁻⁵ |
2.9 x 10⁻⁵ |
(0.22-0.78) x 10-5 |
17 |
|
Formaldehyde |
10 x 10-5 |
0.6 x 10⁻⁵ |
1.3 x 10⁻⁵ |
4 |
|
Acetaldehyde |
0.2 x 10⁻⁵ |
0.27 x 10⁻⁵ |
0.22 x 10⁻⁵ |
2 |
|
Ethene |
5 x 10⁻⁵ |
17 |
||
|
Propene |
1 x 10⁻⁵ |
3 |
||
|
1,3‑Butadiene |
30 x 10-5 |
17 x 10-5 |
3 x 10⁻⁵ |
100 |
|
PAH (including benzo(a)pyrene) b |
2800 x 10-5 |
9333 |
||
a In the normalization, 1,3-Butadiene = 100. OEHHA 2009 factors are used for substances other than ethene, propene and PAH, for which factors of Nordic Ecolabelling are used. b Toxic equivalence factors are presented in PAH Chapter.