
Emissions
Methane used as a fuel may slip as methane emissions, which has high global warming potential (GWP over 100 years is 28 for methane). Methane emissions from NG fuelled vehicles can be reduced by exhaust aftertreatment devices to low levels, but not necessarily for all engine concepts. In the older studies, methane emissions from a CNG bus were around 150 mg/km (Murtonen and Aakko-Saksa 2009) and even as high as 2750 mg/km (review, Hesterberg et al. 2008). Karlsson et al. (2008) noticed that, methane represented 74% of hydrocarbon emissions at normal temperature for biomethane fuelled vehicles. In Annex 57 (Söderena et al. 2021), tested methane engines (stoichiometric spark-ignited and HPDI dual-fuel) had relatively low methane emissions, especially in comparison with older lean-burn engines and port-injected dual-fuel engines. In the cold-start tests, methane emissions were elevated in some cases.
Another emission species having a high GWP is nitrous oxide (N2O) emission (GWP100 is 265). The testing in AMF Task 57 (Söderena et al. 2021) revealed that N2O emissions can be a problem for vehicles equipped with specific selective catalytic reduction (SCR) systems, depending on chemistry, however, parallel testing of Euro VI Step C and Step D vehicles confirmed that the problem can be controlled.
In AMF Task 51 (Schramm, J. 2020), a number of vehicles were tested for tailpipe methane emissions and the results indicated that the major contribution of methane originates from slip during driving. The key mechanisms behind unburned methane emissions was identified due to misfire/bulk quenching, wall quenching, crevice volumes, post oxidation and valve timing/overlap. The major problems with unburned methane formation were associated with medium speed 4-stroke dual fuel engines. Since the unburned methane emissions origin from areas near the combustion chamber walls, the sensible way forward is towards direct injection of natural gas/bio-methane in order to reduce emissions. AMF Annex 51 dealt also with methane oxidation catalyst chemistry and regeneration issues.
In AMF Task 51 (Schramm, J. 2020), addition of hydrogen to NG (so called hythane concept) in a test with a stoichiometric operated Euro 4 CNG vehicle showed significant reductions in THC (including methane) and NOx emissions. Hydrogen blending could be an interesting option for processes with diluted mixture formation (lean or EGR operation).
CO, HC, NOx, PM and PN emissions
The different principles of engines affect the exhaust emissions and their control strategies. Capability of the stoichiometric gas engine to control emissions efficiently via a three-way catalyst (TWC) is an advantage over the compression ignition and lean-burn engines, in which the excess oxygen in exhaust prevents using TWCs to oxidize CO and HC while reducing NOx. For the DF engine, the emission legislations (e.g. EURO V and later) require that the engine is equipped with similar after-treatment technology as diesel engines, which means installation of a selective catalytic reduction (SCR), an oxidation catalyst and a diesel particulate filter (DPF). NGVs equipped with TWCs meet EURO VI NOx emission requirements.
Recent work in the AMF Task 57 (Söderena et al. 2021) covered methane fuelled trucks tested in Finland and Sweden. Examples of the NOx and particle number (PN) emissions are presented in Figure 1. NOx and PM emissions were generally below Euro VI limits. For tested vehicles, NOx emissions were low and NOx conformity factors (CF) passed the ISC criteria for both Step C and D vehicles. Interestingly, the Step D diesel had higher NOx emissions than the Step C vehicles. PM emissions were low for all vehicles, below 6 mg/kWh. PN emissions were also low, although slightly higher for HPDI LNG than for diesel.
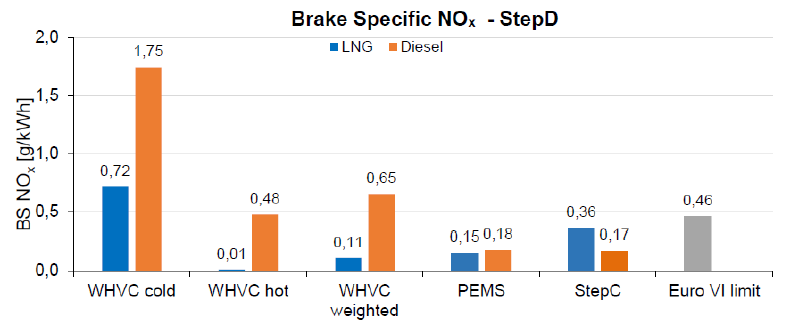
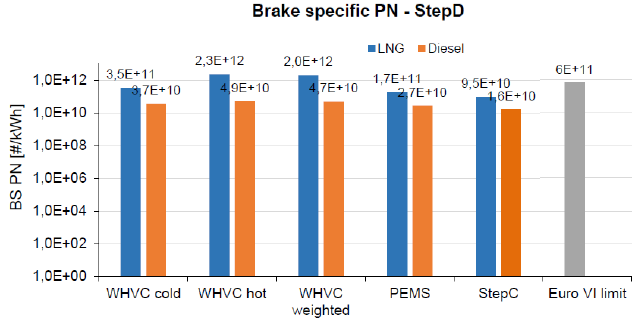
Figure 1. NOx and PN emissions, Euro VI Step D vehicles (AMF Task 37, Söderena et al. 2021).
A study with buses, AMF Task 37 reported by Nylund and Koponen (2012), showed that natural gas in combination with stoichiometric combustion and TWC delivers low regulated emissions, whereas lean-burn natural gas engines are characterized by high NOx emissions (Figure 2). All natural gas engines, independent of combustion system, delivered low particulate matter emissions, i.e. equivalent to particulate filter equipped diesel engines.
For diesel engines certain aftertreatment devices increase tailpipe NO2 emissions, which is also the case for lean-burn CNG engines, whereas stoichiometric CNG engines are low emitters of NO2. The share of NO2 of NOx was 35–70 % when engines were equipped with NO2 producing aftertreatment devices, but in other cases below 5% in Nylund and Koponen (2012). As an example, a mean NO2/NOx ratio for typical heavy-duty (EEV classified) diesel engines is in the range of 0.4 to 0.6, while typical values for respective natural gas engines is in the range of 0.01 to 0.05 (Kytö et al. 2009).
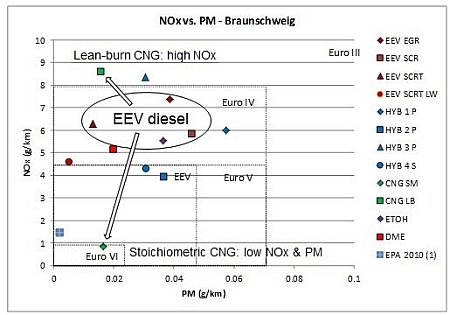
Figure 2. NOx and PM emission results for European vehicles (Nylund and Koponen 2012).
AMF Task 39 "Enhanced Emission Performance and Fuel Efficiency for HD Methane Fuelled Engines" (Olofssen et al. 2014) investigated the development level of the methane fuelled engines for heavy duty vehicles (HDVs) and the potential to reach high energy efficiency, sustainability and emission performance. Task 39 included a literature study (Broman et al. 2010) and testing in Sweden, Finland and Canada. Vehicles tested were spark ignited (SI) dedicated gas engines and vehicles equipped with DF NG/Diesel engines. Methane used was CNG and sometimes mixed with biomethane. Testing in Canada included HPDI DF concept using LNG and diesel. The tested dedicated SI gas buses operates only on gas, while the DF concept could use variable mix of diesel and methane gas or only diesel fuel. However, the truck using HPDI-technology could only operate properly when both methane and diesel fuel is available. HDVs equipped with dedicated SI methane engines showed low emissions. The bus was well in line with Euro VI emission requirements and is considered as “best in class”. HDVs equipped with DF methane/diesel technology had difficulties in achieving the theoretical diesel replacement capacity of 75-80%, particularly at low engine loads. Furthermore, to reach Euro V/EEV and Euro VI emission levels, obviously advanced combustion control and thermal management are needed. The average ratio for diesel replacement is expected to be about 60%.
AMF Task 39 (Olofssen et al. 2014) included also tests with retrofit systems of HD Euro III vehicles converted to use DF methane/diesel technology. The emission performance will be dramatically negatively affected, except for the PM emissions. However, a possible advantage might be to reduce operating costs for the vehicle.
AMF Task 39 highlighted that 1) NG/Diesel dual fuel concepts: Difficult to meet Euro V/VI emission standards with technology available by 2014; Suitable only for OEM applications (not for retrofitting); Diesel replacement depends on load and is lower than expected; Total GHG emissions might be higher for NG/diesel than for diesel vehicles 2) Dedicated spark ignited engines (SI):No problem to meet Euro V/EEV emission requirements; Lower engine efficiency when compared to diesel especially for lean-mix applications (18% vs. 33%); Lean-mix concept operating mostly on lambda over one.
Numerical emission results as examples are collected in Table 1 (buses, trucks) and Table 2 (cars) including emissions from older and newer vehicles using methane as fuel. Generally, when equipped with efficient exhaust aftertreatment devices, most emissions are at similar levels with diesel and methane fuelled vehicles. However, NOx emissions tend to be still lower with TWC equipped CNG than with diesel fuelled buses. For the NGVs different combustion principles lead to differences in emissions, for example, with spark ignition engines the tailpipe NOx and PM emissions are typically low, while for non-optimized lean-burn CNG vehicles these emissions may be elevated. Formaldehyde, acetaldehyde, 1,3-butadiene, and benzene emissions have been reported to be lower for CNG vehicles than for gasoline or diesel vehicles. Ammonia (NH3) emission tends to be high for TWC equipped vehicles, which has been observed also for the TWC equipped CNG bus. Low levels of carcinogenic emissions, such as 4-ring polycyclic aromatic hydrocarbons, have been observed with CNG fuelled vehicles and cars. In addition, Ames mutagenicity of particulate matter has been repotedly lower for CNG vehicles when compared to diesel vehicles.
For natural gas fuelled cars, CO, HC, and NOx emissions were low in the AMF Task 22 (Aakko and Nylund 2003). In addition, the dedicated, monofuel CNG car was quite insensitive towards ambient temperature, whereas CO and HC emissions from gasoline cars increase as ambient temperature decreases down to -7 °C. Karlsson et al. (2008) observed quite small differences in emissions between bi-fuelled biomethane and gasoline car at -7 °C. However, difficulties in switching fuel from gasoline to biomethane (CBG) for a bi-fuel NGV after the cold start at -7 °C led to higher CO emission, but lower NOx and PM emissions for CBG than for gasoline car at -7 °C. A study with Euro 6a cars (including AMF Task 44) using alternative fuels observed low emissions even at cold ambient temperatures (Aakko-Saksa et al. 2020). The CNG fuelled cars were the “cleanest” of the cars studied: only methane emissions were elevated.
Table 1. Examples of emissions from heavy-duty vehicles (buses, trucks) using diesel or methane as fuel.
|
|
Diesel w/o [mg/km] |
Diesel+DPF [mg/ml] a [mg/km] b, d |
CNG+TWC [mg/ml] a [mg/km] b |
LB CNG ox. cat./ SM CNG [mg/km] |
CNG / LNG [mg/km] |
|
CO |
|
600; 1400 a |
4900; 17900 a |
|
4943/490 e |
|
HC |
|
100; 1000 a |
3500; 5300 a |
|
898/437 e |
|
NOx |
8000; 9000 d |
26000; 82000 a 9000; 20000;6000 d |
7700; 8700 a |
7000; 8000 d / 2000 d |
139/130 e |
|
NO2 |
100; 1000 d |
11600 a 800; 10000; 3000 d |
100 a |
300 d / 50 d |
|
|
N2O |
|
<120b <40b |
|
|
7/255 e |
|
NH3 |
|
<10b 280b |
|
|
|
|
PM |
170; 120 d |
30; 240 a 20:10;10 d |
40; 20 a |
10; 10 d / 5 d |
2.2/1.7 e |
|
Methane |
|
0a <15b |
2750 a 0.15b |
|
788/432 e |
|
Benzene |
3; 3 d |
0.4a <3b 1; 0.4; 0 d |
0 a <0.003b |
0; 0.06 d / 0 d |
|
|
1,3-Butadiene |
8 d |
2.3a 0b 0; 0; 1 d |
0 a 0b |
0; 0 d/ 0 d |
|
|
Ethylene |
|
3.4a <10b |
0 a 0b |
|
|
|
Propylene |
|
0.2a <2b |
0 a <0.002b |
|
|
|
Ethylbenzene |
|
0.1a |
1.4 a |
|
|
|
Toluene |
|
0.1a <5b |
2.3 a <0.005b |
|
|
|
o-Xylene |
|
0.4a |
0.4 a |
|
|
|
m/p-Xylene |
|
0.2a |
0.9 a |
|
|
|
Formaldehyde |
37; 25 d |
3.4a <13b 5; 3; 5 d |
0.0 a 0.003b |
|
|
|
Acetaldehyde |
|
1.9a <4b |
0.4 a 0b |
|
|
|
Acrolein |
|
0.1a 0 b |
0b |
|
|
|
|
µg per distance |
µg per distance |
µg per distance |
µg per distance |
|
|
PAHs A/B |
613 d |
10/6 a <42/<4b 94; 90 d |
<1 b 0.1/0.5 a |
8; 30 d / 7 d |
|
|
|
krev/km |
krev/km |
krev/km |
krev/km |
|
|
Ames TA98-S9 |
59 d |
<15 b 23; 20 d |
0 b |
3; 50 d / 1 d |
|
a Hesterberg et al. 2008 b Murtonen and Aakko-Saksa 2009 c AMF Task 22 Nylund and Aakko 2003 d Nylund et al. 2004 e AMF Task 57 Söderena et al. 2021
Table 2. Examples of emissions from cars using diesel or methane as fuel.
|
|
Diesel+DPF a [mg/ml] a [mg/km] c |
Diesel, Euro 6a -7 °C [mg/km] |
CNG a [mg/ml] a [mg/km] c |
CNG, Euro 6a -7 °C [mg/km] |
|
CO |
110 a |
97 b |
680 a |
75 b |
|
HC |
20 a |
15 b |
950 a |
98 b |
|
NOx |
820 a |
463 b |
290 a |
201 b |
|
PM |
0 a |
0.5 b |
18 a |
0.6 b |
|
|
+23/-7 ° |
|
+23/-7 °C
|
|
|
NO2 |
|
92 b |
|
1 b |
|
N2O |
|
16 b |
|
0.1 b |
|
NH3 |
|
0.4 b |
|
6.2 b |
|
Methane |
<10/<24 c |
9 b |
52/84 c |
96 b |
|
Benzene |
<5/<15 c |
0.2 b |
0/0 c |
0.1 b |
|
1,3-Butadiene |
<1/<2 c |
0 b |
0/0 c |
0 b |
|
Ethylene |
<7/<24 c |
|
0/0.5 c |
|
|
Propylene |
<4/<12 c |
|
0/0 c |
|
|
Ethylbenzene |
<2/<10 c |
|
0/0 c |
|
|
Toluene |
<10/<55 c |
|
0/2 c |
|
|
o-Xylene |
<1/<8 c |
|
0/0 c |
|
|
m/p-Xylene |
<3/<22 c |
|
0/2 c |
|
|
Formaldehyde |
<5/<23 c |
0.3 b |
0/0 c |
0.3 b |
|
Acetaldehyde |
<3/<18 c |
0.4 b |
0/0 c |
0.1 b |
|
Acrolein |
|
|
|
|
|
PAHs A/B |
|
0.0001 b |
|
0 b |
|
Ames TA98-S9 |
|
11 b |
|
3 b |
a Hesterberg et al. 2008 b Aakko-Saksa 2020, incl. AMF Task 44 c AMF Task 22 Nylund and Aakko 2003
CNG delivers very low particle number emissions, almost two orders of magnitude lower than diesel technologies (Figure 3). However, diesel vehicles equipped with DPF produce particle numbers comparable to CNG. The highest particle numbers were clearly observed for diesel buses without DPF in a study by Nylund and Koponen (2012, AMF Task 39). Karlsson et al. (2008) observed lower particulate mass and number emissions for a biomethane fuelled car than for a gasoline car.
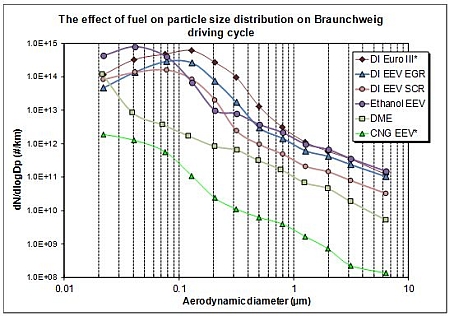
Figure 3. Particle number size distribution for a number of technology alternatives (indicative). (Nylund and Koponen 2012).