
Advanced Motor Fuels in United States
Background
Vehicles move the American economy. Each year in the United States, vehicles transport 18 billion tons of freight — about $55 billion worth of goods each day[1] — and move people more than 3 trillion vehicle-miles.[2] Growing our economy requires transportation, and transportation requires energy. The transportation sector accounts for approximately 27% of total U.S. energy needs[3] and the average U.S. household spends over 15% of its total family expenditures on transportation,[4] making it, as a percentage of spending, the costliest personal expenditure after housing. Transportation is critical to the overall economy, from the movement of goods to providing access to jobs, education, and healthcare.
The transportation sector has historically relied heavily on petroleum, which supports over 90% of the sector’s energy needs today,[5] and, as a result, surpassed electricity generation to become the largest source of greenhouse gas emissions in the country.[6]
Advanced Motor Fuels Statistics
The U.S. Energy Information Administration (EIA) estimated that total U.S. transportation energy consumption for 2023 was 28,057 trillion British thermal units (Btu) — 2% higher than in 2022.[7] About 90% of this consumption is petroleum-based fuels (gasoline and diesel), with much of the remainder being ethanol blended into gasoline at 10%. Biomass accounted for 1,788 trillion Btu during 2023, natural gas for 1,322 trillion Btu, electricity for 57 trillion Btu, and propane for 10 trillion Btu.[8]
Biofuels
The best biofuel use data come from the EPA’s recording of Renewable Identification Numbers (RINs) filed by refiner/marketers of liquid transportation fuels, as shown in Figure 1.[9] Each RIN is equivalent to 1 gallon of ethanol by Btu content; RINs are generated when a motor fuel refiner/blender blends or sells the renewable fuel or fuel blend. Renewable fuel volumes grew from 20.7 billion gallons in 2023 to 21.7 billion gallons in 2024, as fuel consumption continued to grow after the first year of the pandemic.
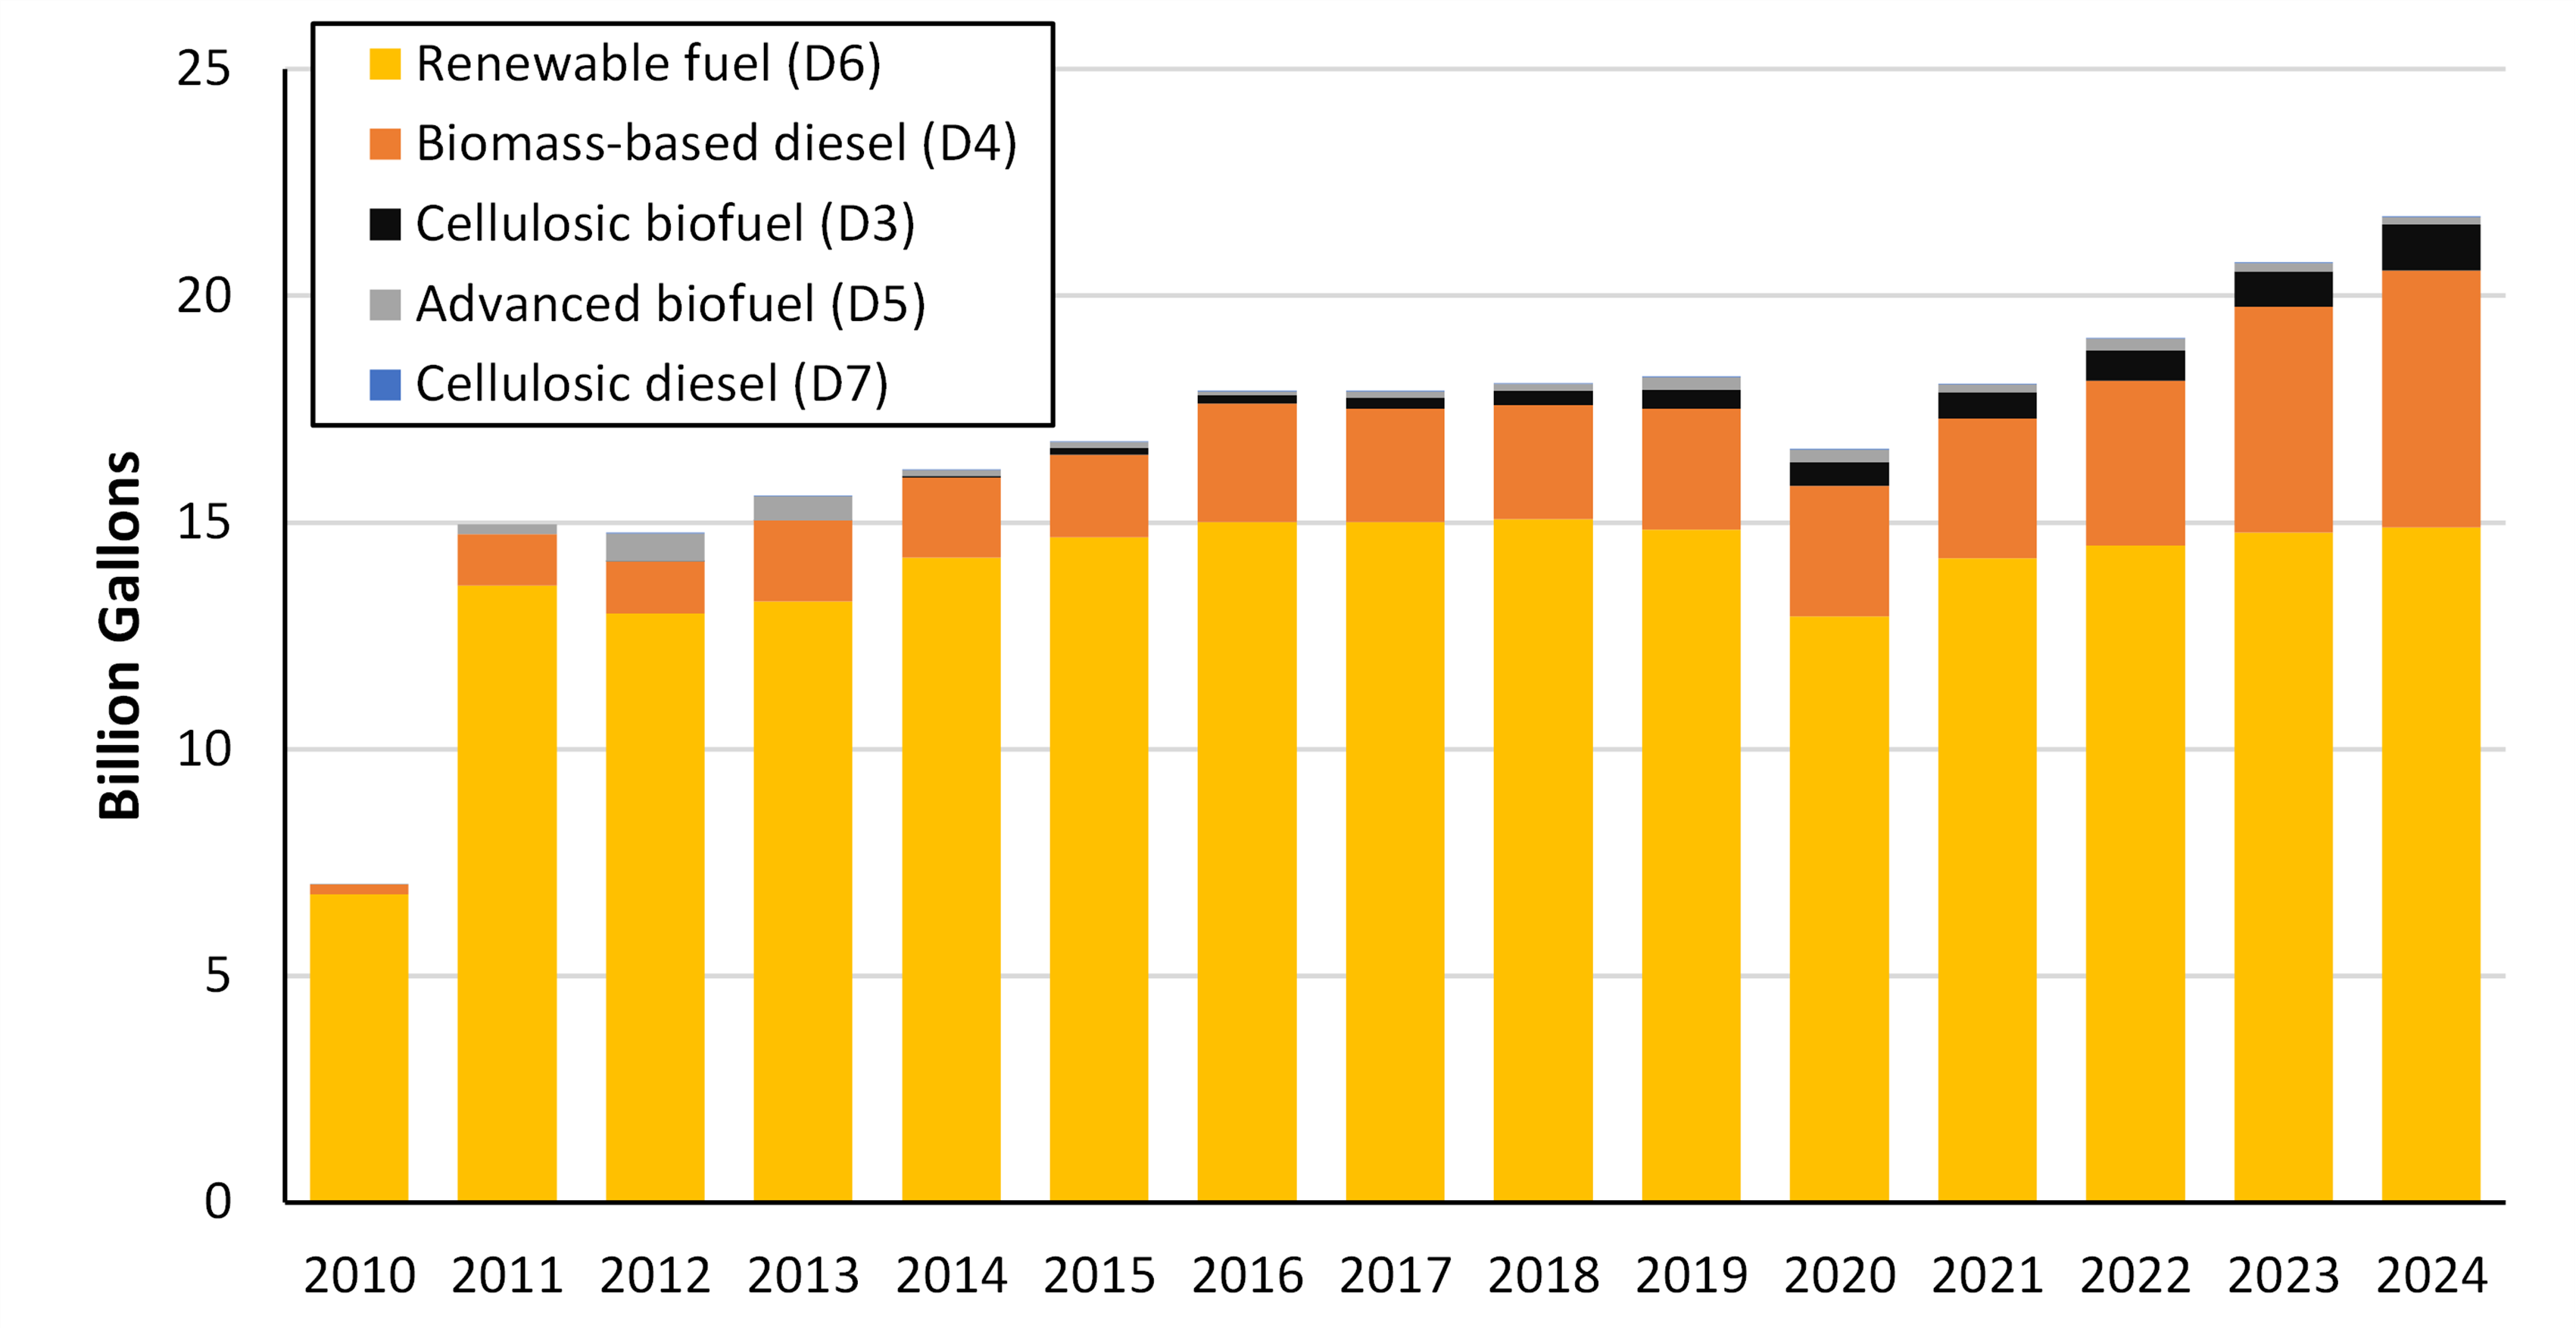
Figure 1. Renewable Fuel Volumes Resulting from U.S. Renewable Fuel Standard
Electric Vehicles
Sales of plug-in hybrid electric vehicles (PHEVs) and BEVs in 2024, totaling 1,569,430, were an 8% increase over 2023.[10] In addition, sales of HEVs (non‑plug-in) were up 37% in 2024, totaling 1,609,035.[11] As of March 2025, consumers could choose from 144 available plug-in models for model year 2025.[12]
Alternative Fuel Infrastructure
The DOE’s Alternative Fuels Data Center provides the number of alternative fuel refueling stations in the United States.[13] As Table 1 shows, exclusive of electric recharging stations, the total number of alternative fueling stations in the United States increased by 61% between 2012 and 2024. However, the number of compressed natural gas (CNG) and liquefied natural gas (LNG) stations decreased slightly in 2024. The total number of public and private non-residential EV recharging outlets jumped by over 1500% over this period, with a 24% gain in 2024.
Table 1. U.S. Alternative Fuel Refueling Stations by Type, 2012–2024 (including public and private stations)
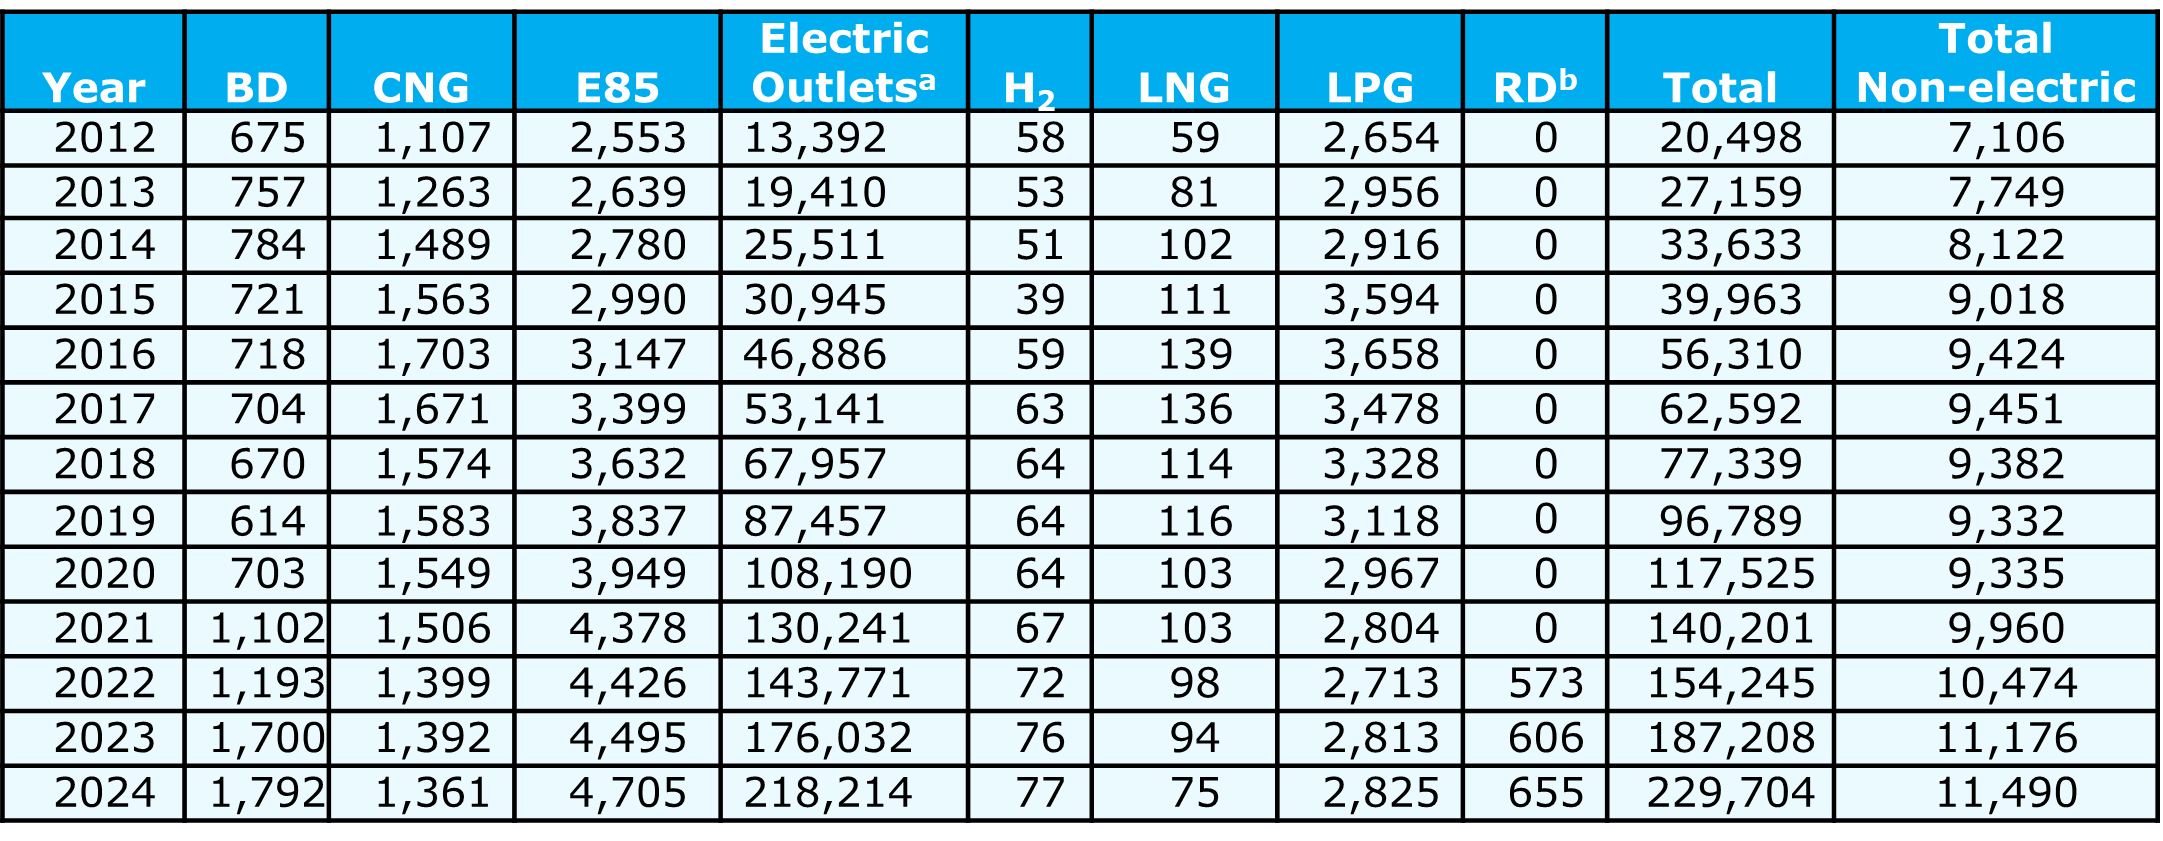
a Total number of recharging outlets, not sites.
b Renewable diesel (RD) station data collection began in 2022.
Research and Development Focus
The DOE’s Vehicle Technologies Office (VTO) sponsors R&D in a broad range of technologies for all levels of vehicles and transportation systems. Areas of active research include energy storage, electric drive, materials, powertrain and fuels for non-road applications, mobility systems, and technology deployment. VTO’s current portfolio in internal combustion engine vehicle area comprises the following: conducting research in fuels and advanced combustion engines, improving match between engines and fuel characteristics, and increasing engine and vehicle efficiencies. This research covers a very broad range of fuel, engine, and vehicle technologies.
Outlook
The EIA’s Annual Energy Outlook 2023 (AEO 2024 was not published due to model enhancements) projects decreasing on-road transportation energy use from 2021 through 2043 resulting from mandated increases in fuel efficiency and increased use of electric vehicles. However, growth in travel demand, largely attributable to the increase in use of light trucks in place of passenger cars, will outpace these benefits, and energy use will increase from 2044 to 2050.[14] The EPA’s GHG emission standard for light-duty vehicles (LDVs) incentivizes the introduction of efficient vehicle technologies and electrified vehicles including PHEVs, BEVs, and FCEVs. The federal government and the auto industry anticipate electrification of the U.S. LDV fleet by 2050. Low-carbon fuels in internal combustion engines can help lower emissions of long-haul trucks, the aviation sector, and the marine sector.
Additional Information Sources
- Oak Ridge National Laboratory, “Transportation Energy Data Book”
- DOE, Federal and State Laws and Incentives
- EIA, Monthly Energy Review
- DOE, Technology Integration Program
- DOE, BETO program
[1] Bureau of Transportation Statistics, DOT, Transportation Statistics Annual Report 2020, Table 4-1, https://www.bts.gov/tsar.
[2] Davis, Stacy C, and Robert G Boundy. Transportation Energy Data Book: Edition 40. Oak Ridge, TN: Oak Ridge National Laboratory 2022. https://doi.org/10.2172/1878695. Table 3.09 Shares of Highway Vehicle-Miles Traveled by Vehicle Type, 1970-2019.
[3] Ibid. Table 2.02 U.S. Consumption of Total Energy by End-use Sector, 1950-2021.
[4] Ibid. Table 11.1 Average Annual Expenditures of Households by Income, 2020.
[5] Ibid. Table 2.03 Distribution of Energy Consumption by Source and Sector, 1973 and 2021.
[6] Environmental Protection Agency, Draft U.S. Inventory of Greenhouse Gas Emissions and Sinks, 1990-2019, Table 2‑11. Electric Power-Related Greenhouse Gas Emissions and Table 2-13. Transportation-Related Greenhouse Gas Emissions.
[7] EIA, EIA Monthly Energy Review, March 2024.
[8] Ibid.
[9] EPA, 2025, EPA Moderated Transaction System, February 2025.
[10] Argonne National Laboratory, 2025, “Light Duty Electric Drive Vehicles Monthly Sales Updates.”
[11] Ibid.
[12] DOE, 2025, Alternative Fuels Data Center, “Availability of Hybrid and Plug-In Electric Vehicles.”
[13] DOE, 2025, “Alternative Fueling Station Counts by State.”
[14] Energy Information Administration, 2023, Annual Energy Outlook 2023.